
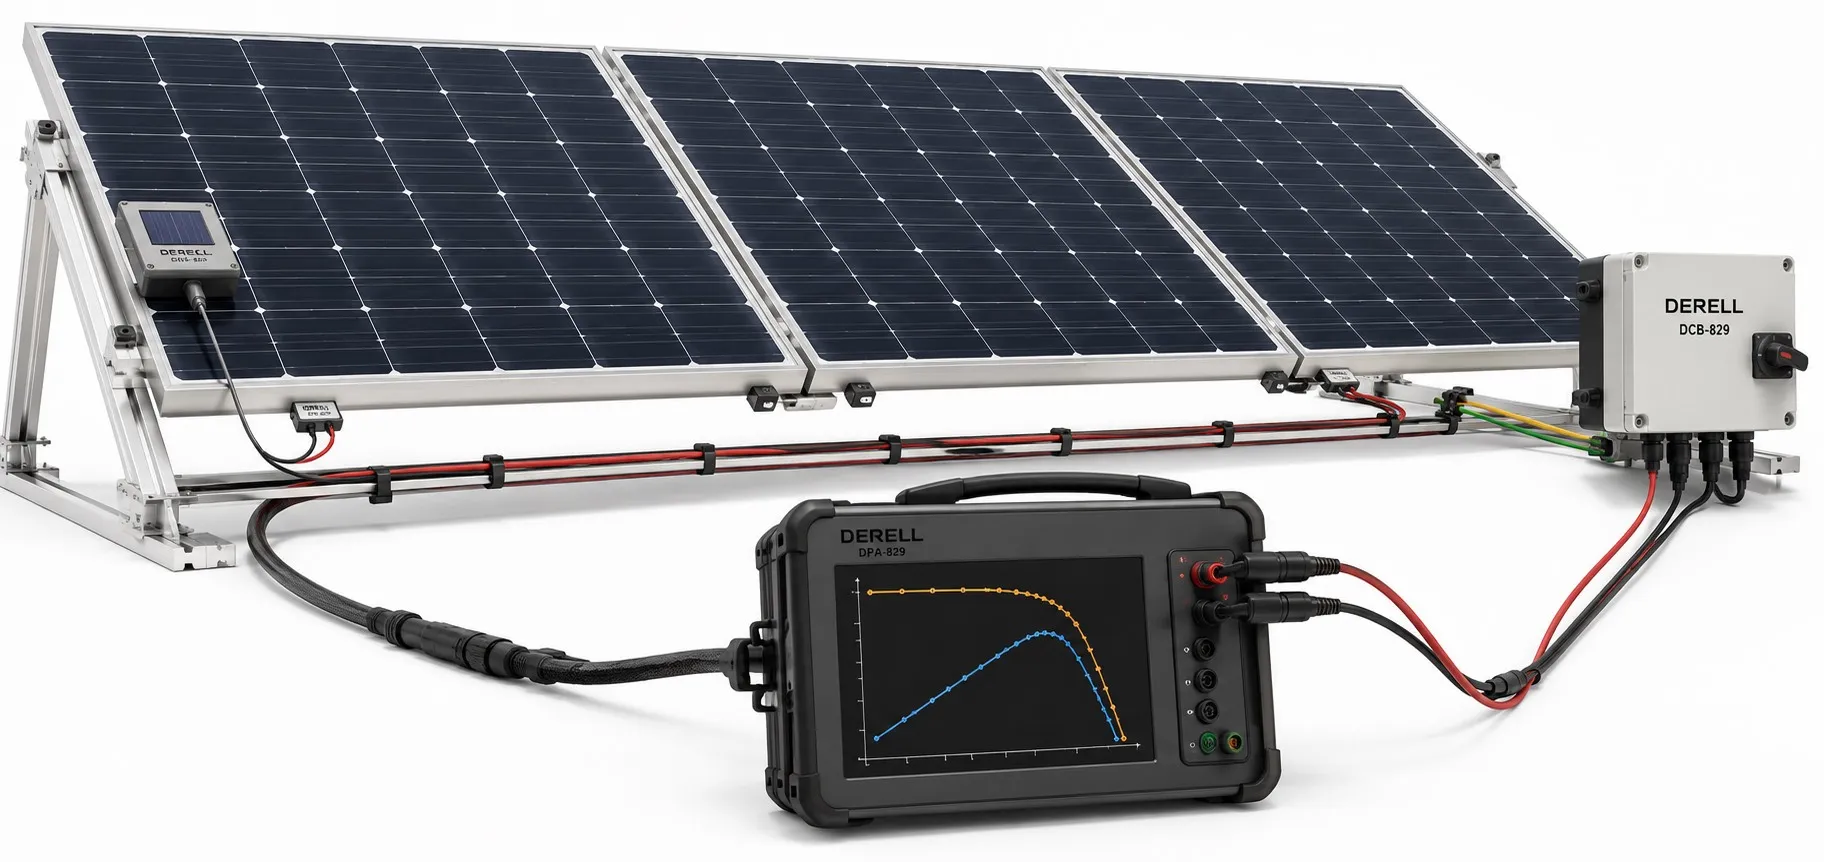
IEC 61829: Making Sense of On-Site PV Array Measurements
IEC 61829 addresses the on-site measurement of current–voltage characteristics of flat-plate photovoltaic arrays. It covers the accompanying meteorological measurements and the use of those data to translate results to standard test conditions or other selected reference conditions.
The published second edition is IEC 61829:2015. Its practical purpose is to help answer a specific question: Does this installed PV array behave as expected under the irradiance and temperature conditions present during the test?
Keep the scope clear: IEC 61829 is not an annual energy guarantee or a general energy-rating standard. A field I–V measurement, monthly production records and a performance-ratio assessment answer different questions.
Know Exactly What You Are Measuring
A solar panel usually means a PV module. Modules connected in series form a string, while an array can contain one or more strings. The series and parallel arrangement determines the voltage and current range that the test equipment must handle.
A report should identify the actual circuit tested, its module count and its configuration. “Panel tested” is too vague when the measurement covered a complete string. The PV module technology also matters when selecting a performance model and temperature-correction data.
What an I–V Curve Tells You
An I–V curve shows the current available from a PV source at different terminal voltages under a particular set of environmental conditions. It describes a range of operating points rather than a single meter reading.
Voc — Open-circuit voltage: The voltage at approximately zero output current.
Isc — Short-circuit current: The current at approximately zero terminal voltage, assessed through a controlled measurement using suitable PV test equipment.
Vmp and Imp: The voltage and current at the maximum power point. These values belong to the same operating point, giving Pmax = Vmp × Imp.
Example: A maximum power point of 400 V and 8 A corresponds to 3,200 W, or 3.2 kW. That is DC power under the test conditions, not the day's production in kilowatt-hours. Also, Voc multiplied by Isc is not maximum power: the two values occur at different operating points.
I–V Tracing and MPPT Serve Different Purposes
Maximum power point tracking seeks a suitable electrical operating point while the system is producing energy. An I–V tracer sweeps through operating points to characterize the PV source.
The instantaneous power displayed by a solar inverter does not reveal the complete I–V curve. Its AC output power is also a different quantity from the DC maximum power measured at the array.
The Conditions Behind a Useful Measurement
Irradiance: Measure the sunlight reaching the array plane alongside the electrical data. Fast-changing weather conditions, such as passing clouds, can undermine comparisons between readings taken at different times. Irradiance sensor orientation and tilt should represent the array being tested.
Shading and surface condition: Shade and panel orientation affect the result. Record soiling, bird droppings and temporary obstructions so that an environmental effect is not mistaken for permanent module damage.
Temperature: Ambient air temperature is not cell temperature. Use an appropriate temperature sensor and a suitable measurement method. With a Pt100 sensor, for example, instrument compatibility, surface contact and the relationship between the measured surface temperature and cell temperature all require attention.
Instrumentation: The tracer must suit the source's voltage, current and measurement characteristics. Taking a few readings with a conventional multimeter does not replace an I–V sweep. Calibration information and measurement uncertainty belong in the assessment as well.
Why Translate Results to Reference Conditions?
Raw power readings from two strings are not directly comparable if irradiance or cell temperature changed between tests. Standard test conditions, or STC, generally refer to 1,000 W/m² irradiance, 25 °C cell temperature and the AM1.5 reference spectrum.
IEC 60891 provides procedures for correcting measured I–V characteristics for temperature and irradiance. A valid comparison needs an appropriate correction method, suitable module data and attention to the method's limits.
Multiplying a low-irradiance power reading by a simple scaling factor is not a complete STC correction. Nor does one field power reading establish module efficiency on its own.
Using Curve Shape to Investigate Losses
Lower-than-expected current: Check irradiance, soiling and shading before concluding that an electrical fault is responsible. An incorrect irradiance measurement can also distort the comparison with the predicted curve.
Lower-than-expected voltage: Investigate temperature, series module count, circuit connections and possible bypass behavior.
Steps or changes in curve shape: Partial shading, mismatch and bypass-diode operation are possible explanations. However, a particular curve shape does not always identify a unique fault.
These observations can help target PV maintenance. A reduction originating on the array side should not automatically be treated as an inverter malfunction.
Build a Report That Can Be Used Later
A useful field report keeps the circuit identifier, module model and quantity, wiring arrangement, date and time, irradiance, temperature, surface condition, instrument details and raw I–V data together. Identify the correction method and distinguish measured results from values translated to reference conditions.
A SCADA system can provide historical production and environmental context. Sensor data collected through a PLC may also support the record. Data logging alone, however, does not demonstrate that the measurement chain is calibrated or that an I–V sweep has been performed.
How IEC 61829 Fits with Other PV Standards
Commissioning: Relevant parts of the IEC 62446 series address documentation, verification and maintenance. I–V testing does not replace every other inspection or electrical test required for an installation.
Array design: IEC 62548 addresses PV array design requirements. A normal-looking curve does not establish that all cable, protection and grounding arrangements are correct.
Product assessment: IEC 62109 concerns PV converter safety, IEC 61215 addresses module design qualification, and IEC 61730 addresses module safety. These are separate from an array's field I–V measurement.
Concentrator photovoltaics: IEC 61829's flat-plate array scope should not be transferred automatically to CPV equipment. IEC 62108 addresses CPV design qualification, while the IEC 62670 series covers CPV performance testing.
Long-term performance: IEC 61724-1 provides a framework for PV performance monitoring. Module energy rating is addressed by the IEC 61853 series, with Part 3 covering energy-rating calculations.
Turn the Measurement into a Sound Decision
I–V results can help assess array data used in inverter selection and support investigations into PV system energy losses. Meaningful conclusions require comparable conditions, appropriate product data and a realistic allowance for uncertainty.
Within the wider set of solar energy standards, IEC 61829 helps make the conditions behind a field measurement explicit. A useful report explains both the measured output and the circumstances that produced it.
PV arrays remain a source of voltage while illuminated. I–V testing requires qualified personnel and suitably rated DC equipment; PV connectors must not be disconnected under load.